article
01/05/2021
Using data in e-sports
Data analysis of the PUBG Global Invitational PGI.S esport tournament
For several years now, sports professionals have been using data analysis to achieve their goals: improving results, developing potential, streamlining decision-making... A movie (Moneyball) was even dedicated to the appearance of this practice in baseball in the United States.
Esport has a huge advantage over physical sports in that a large amount of data from a match is recorded on the game server. Apart from the health data of the players, there is no need to manually enter the game actions, nor to set up devices to record the players' positions...
The entry cost to implement data analysis practices in esports is therefore relatively low, and all professional teams and structures would be well advised to use them generously to gain meaningful insights.
From February 5 to March 28, 2021, the PGI.S tournament was held in South Korea, where 32 of the world's best teams competed in PlayerUnknown's Battlegrounds (PUBG). Let's see what there is to say about it.
About PUBG
PUBG is a battle royale game. In esport, 16 teams of 4 players drop on a map. At regular intervals, a circle (zone) appears that shrinks more and more, which must be reached or else the health of one's avatar will decline. Players can be knocked down but reanimated (revived, or 'rezed' for resurrected) by their teammates if they intervene quickly enough. If they could not be revived, their game is over.
The team that wins the match is the one with at least one member who is the last player alive (Top 1), having survived the attacks of the competing teams and the damage done by being out of the zone (in the blue).
The different phases of a match:
- phase 0.1 = start of the game, the players jump from the plane and join the map
- whole phases (1, 2, 3...) = a new circle appears
- phases ending with .5 (1.5, 2.5, 3.5...) = the game zone closes progressively on the circle
Duration of phases and consecutive circles


PGI.S and the "WWCD controversy"
The PGI.S innovated by creating weekly tournaments that saw different methods to determine the winner.
For several years now, the main tournaments have been using the so-called SUPER rules (for Standard and Universal PUBG Esports Ruleset), which among other things specify a point system that rewards the final placement in each match as well as the number of opponents eliminated (kills) during the match. Without going into detail, a team that finishes a match in 3rd place with 10 kills is awarded the same number of points as a team that finishes in 1st place with 5 kills.
During the PGI.S, weekly survival tournaments adopted a system rewarding exclusively the teams finishing in 1st position (WWCD for "Winner Winner Chicken Dinner", the text that the winner sees displayed on his screen when he wins a match).
For the teams, it changes the way they will approach the games.
PUBG Esports announced in early April 2021 that the next PCS4 (PUBG Continental Series 4) tournament would follow the WWCD format, rewarding the number of Top 1s achieved by each team, and only counting kills to break the tie.
A number of pro players as well as fans are vociferous in their rejection of this format. In particular, it is criticized for not rewarding the consistency of teams that regularly finish among the best placed and show skill in eliminating their opponents without winning the games, as well as for favoring chance and luck, arguing that a team dropping near the place where the last zone will appear can finish Top 1 without having had to do anything during almost the entire game.
The analysis of the data of the PGI.S matches which saw the co-existence of the 2 types of formats should allow to draw some lessons on this subject.
There are possible limitations to the results of this analysis:
- The WWCD format is brand new and unusual for teams that have not yet had time to adapt their playstyle. New metas will certainly emerge as the pros get used to it and identify new ways of playing that are more likely to make them win.
- At the PGI.S, the WWCD format allowed teams to qualify for the final. Only one Top 1 had them qualified and they had no more matches to play, which is different from a tournament where the final ranking is determined in WWCD. In addition to new strategies at the match level, new strategies at the tournament level will also be implemented.
Analysis of the PGI.S games
Number of matches
A total of 220 PGI.S matches were analyzed:
- 124 matches in SUPER format
- 96 matches in WWCD format
Duration of the matches
The average duration of matches played in the WWCD format is slightly higher than that of matches played in the SUPER format: 1870 seconds vs 1820 seconds

If we go into a little more detail, we can see that 80% of the games played in the WWCD format ended in the last possible phase, whereas this is the case for just over 60% of games played in the SUPER format.
In any case, the majority of the matches ended in this phase 9.5

NB: Phase 9 lasts only 10 seconds, which explains the low percentages recorded.
Number of teams and players alive by phase
In the WWCD format, on average the number of teams alive at the beginning of each phase is greater than with the SUPER format, especially in mid game between phases 4 and 8. This is less the case in the final phases.

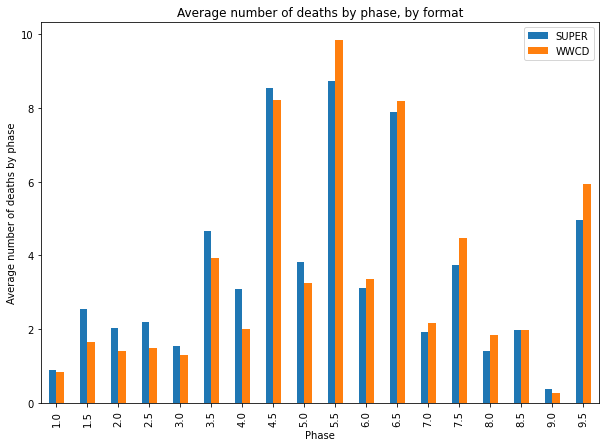
Number of kills by phase
The number of kills by phase allows us to observe that these kills occured mainly during phases in .5, i.e. the phases where the circles close.
The patterns are similar in both formats, but the kills happened later in WWCD than in SUPER.
Rank in number of kills of Top 1 teams
While one of the controversies surrounding the WWCD format is that it does not reward the skill of eliminating opponents, it may be interesting to study the extent to which the teams that place first in a match are the ones that perform the most kills.

It appears that this is mostly the case for both formats. In both cases, for 90% of the games, the team that finishes Top 1 is one of the three teams that made the most kills during the game. However, the figures show that it was more common for the Top 1 team to have the most kills in the SUPER format than in the WWCD format (61% vs 54%).
On the other hand there were more cases in SUPER mode where the team that won the match was far from being the one with the most kills (including one match where the winning team was in 12th place in the kills ranking!)
In any case, we don't see the situation cited by critics of the WWCD format, of teams camping all game long only to win with a ridiculously low number of kills.
Numerical superiority
Numerical superiority is a classic in warfare strategies. Let's look at how this has translated into PUBG over the course of the PGI.S.
For the teams that made Top 1

- There are systematically more teams that have won the matches with 4 players per phase than with 3, 2 or 1 player.
- In the SUPER format, no match was won by a team with only one player before phase 8, nor with only 2 players before phase 4
- Things are slightly different in the WWCD format, where the proportion of matches won by teams with 4 players is higher. Also, matches were won by teams reduced to 1 or 2 players earlier in the game (this is especially true for matches won by teams that were down to 1 player by phase 5).
Results by living teammates
4 teammates

- Unsurprisingly, reaching the late game with 4 teammates allowed teams to take the top spots. This is slightly less the case in the WWCD format than in the SUPER format, which can be explained by the fact that more teams and players reached the late game in WWCD matches.
3 teammates

- Arriving in the late game with 3 players proved to be less decisive to take the best positions, especially the TOP 1, especially in the WWCD format.
2 teammates

- No team that lost two players before phase 3 finished first
1 teammate

- Being solo in early game (or even mid game in SUPER format) rarely gave good results. Even in late game, solos have more often finished 3rd than second or first.
Circle Luck
The term circle luck is used to refer to teams that are in the circle, phase by phase, without having to move. The challenge for many teams is to bet on the location of the end zone to get there as soon as possible to ensure that they survive as long as possible.
Being in the circle
We measure here for each phase and for each final ranking, the percentage of cases where the team was in the circle

- When the first circle appears (phase 1), most of the teams are not in the circle. This seems normal because the maps are large and the teams tend to choose drop spots far from each other.
- The phases in .5 have higher numbers than the previous phases. This makes sense if you consider that the circles appeared in "whole" phases and that teams made sure to take good positions inside them before they closed. The numbers are highest for phases 2.5, 3.5 and 4.5. They are probably lower in phase 1.5 because teams take time to loot at the beginning of the game, the distances to be covered can be important, the circle takes time to close in phase 1.5 and in the worst case, the blue is not very painful at the beginning of the game; lower also in phases in .5 higher than 5.5 because the time to reach the circles decreases, and the space available inside the circles is scarce, it takes more time to insert oneself in them.
- Whether or not you are in the first circle when it appears is not a determining factor in the final placement. The presence rate compared to the final ranking is relatively uniform (30 to 40%). The Top 1 team is not the one with the highest numbers. This is less the case as the phases progress, where the gaps widen and by phase 3 the final placement of the teams is almost always aligned with their presence rate in the circle.
- The patterns between the SUPER and WWCD formats are similar and the numbers are relatively close.
Being as close as possible to the center of the circle
We measure here for each phase, for the teams that made Top 1, the percentage of rank in distance from the center of the circle (rank 1 = closest team, rank 16 = farthest team)

Traditionally, each time a new circle appears, teams will try to move as close to the center of the circle as possible to limit the distance they have to travel to the next circle if it moves away (hard shrink). Teams that are already well placed in the circle will often not move to delay the moment when they will have to face the other teams and risk losing players or being eliminated.
- When the 1st circle appeared (phase 1), the teams closest to the center of the circle (rank 1) had a slight advantage over the teams further away. This is still very slight, and we can for example observe in the SUPER format that the teams in the 8th rank had a fairly close number of cases, while the teams in the 3rd distance rank have the worst numbers.
- It is from phase 7.5 onwards that being closest to the center of the circle seems to be more strongly correlated with finishing Top 1.
- The patterns between the SUPER and WWCD formats are similar and the numbers are relatively close.
Being as close as possible to the end zone
Unlike being closest to the center of the circle, which with the exception of the first circle is something that teams can control (by rotating), being closest to the end zone is the element of chance - and therefore luck - that PUBG has. Not knowing before phase 8 where the end zone will be, it should be noted that teams that were initially close to it may move away from it when they try to get closer to the center of the first circles.
We observe here to what extent this component of chance impacts the teams, and especially if it differs according to the SUPER or WWCD format.

- When the 1st circle appeared (phase 1), the teams closest to the end zone (rank 1) had a slight advantage over the teams farther away. This advantage was greater than the advantage of being close to the center of the phase circle. More importantly, it increased more rapidly as the phases progressed.
- The patterns between the SUPER format and the WWCD format are similar. The advantage seems to be slightly greater in the WWCD format than in the SUPER format in the first phases, but this difference is reversed in the mid-game.
Conclusions
In general
The analysis of these data allows us to draw lessons that are certainly known by experience by professional players. To win a match:
- It is better to arrive at 4 in late game!
- Being the closest to the end zone has a greater advantage than being the closest to the center of the circle in each phase. However, this advantage is not massive from the first zone, so the circle luck seems to result from an intuition that allows the best teams to make the right rotations in the early game.
- All bets are not off from phase 1. On the other hand, from zone 3 onwards, depending on the distance of a team from the center of the circle and its number of teammates, the chances of finishing Top 1 can be very low and lead to consider other types of game strategy.
WWCD vs. SUPER
Most of the patterns studied are similar between the two formats. The most visible differences are:
- The WWCD format seems to see the action shift to the mid/late-game, and it does seem logical that with a system that primarily rewards the Top 1, teams would try to delay the moment they have to fight each other as much as possible.
- The winning teams in the WWCD format are in comparison less often the ones who make the most kills during the match, which makes sense since kills are not valued as much as in the SUPER format. However, the orders of magnitude between the two formats are respected and there are no aberrations.
- To address the issue of a WWCD format that would favor luck, the figures do not show a circle luck that would affect one format over the other.
To go further
Further analysis could be interesting to try to identify possible reasons for the success of the teams: early vs. late rotations, playing in groups vs. split, being aggressive vs. patient, what are the characteristics of the teams that stay with 4 teammates alive the longest...
The upcoming tournaments implementing the WWCD format will allow us to collect new data and observe how professional players evolve to adapt to it.
Methods used
- Use of the PUBG API to get the Json files of the matches:
- Stats: some general stats consolidated at the match level by player (kills, assists, heals...)
- Telemetry: file that logs the events that took place during the match. On average 40.000 events per match ranging for each player to objects picked up, used, vehicles driven, shots, hits, knocks, kills, revives etc. Especially the positions of the players are intermittently logged.
- For each match, data is extracted from the files and indicators are created:
- Around each phase change, for each player alive, collect position data
- Calculation of the distances between the positions of the teammates
- Calculation of the centroid of the teammates' positions to define a team position
- Measurement of the distance separating the team position from the center of the circle and from the final zone. Ranking of the teams according to their respective distances.
- According to the radius of the circles, calculation of the presence of the team's position in the circle
- Data mining and dataviz (python)